Mellom AS (previously NEAS Nett) is one of the power companies servicing Western Norway, specifically Kristiansund and outer Nordmøre. A town by the ocean in North-West Norway and covering the area from Grip to Trollheimen. Dispersed settlements and at times very rough weather conditions makes providing uninterrupted power to 26,000 customers a challenging task for Mellom.
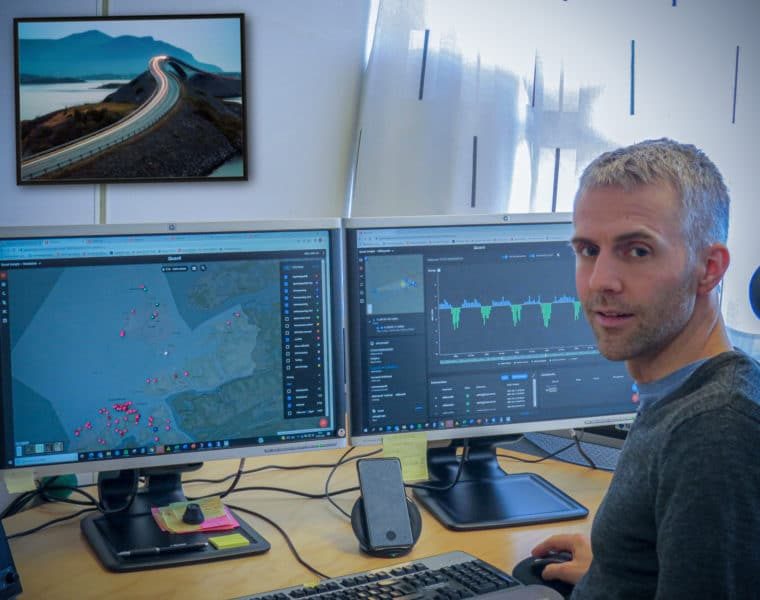
Civil engineer André Gjørven has worked for Mellom for ten years and is currently heading up voltage quality which is his special field of expertise. He has taken part in the digitalisation of the company since autumn 2019 when it got its first AMS map. During the roll-out of new meters, many power companies in Møre and Romsdal teamed up to acquire and install the AMS meters – which resulted in the Smartstrøm Nordvest project. To handle the meter data collection from 153,000 meters, the Smarthub operations company was formed.
In 2020, Smarthub in Molde was acquired by Embriq who was able to contribute its solution for the visualisation of AMS data: Quant Insight.
Quant Insight is a software solution that transforms data into insight. For power companies, this tool provides value in all areas – planning, construction and operations – as well as for the end customer.
Challenge
Initially, the AMS meters were focused on achieving stability of data collection and later progressed to the collection of hourly data from all end customers. Everything was collected in different digital solutions which had many limitations. What was really needed was the ability to compile usage data and see aggregate total load on a line or a transformer. By amalgamating hourly data, the power companies are able to view the way in which the data add up throughout the day and year to a maximum load in the network.
Mellom also saw a growing need for access to live data in order better to be able to map, monitor and troubleshoot in the low-voltage network.
“In our harsh coastal climate, we often experience contact failure and phase breaks as a result of storms, lightning and salt. There are long distances that make sending out engineers in search of breakdowns and earth faults time-consuming and resource-intensive. A system that could enable us to view and analyse these events in the low-voltage grid would be a quantum leap,” says André Gjørven, manager at Mellom AS.

At times, Mellom faces very tough and demanding weather conditions in its coverage area.
The solution
Embriq’s Quant Insight became the solution for Mellom and other power companies in the northwest of Norway. After a short transition period, in which the old system was shut down and all data transferred to the new solution, it was easy to get going with Quant Insight. From then on, it was just a matter of speeding ahead into a new world of knowledge.
“After we got Quant Insight, I quickly set up a new routine while drinking my morning coffee. I decided to check the system for new earth fault and voltage alerts, and I quickly started prioritising this above Facebook. Because Quant Insight turned out to be very efficient in identifying this type of fault. With a bit of proactive work with end customers, we’ve now almost eliminated earth faults in our coverage area. It’s incredible what can be solved by just a few text messages – and the built-in SMS module can be used to contact the end customer,” says Gjørven.
Quant Insight’s key features mean that power companies can react rapidly to events. An event map with different filter options means that a full overview is available and events can be monitored in real time. Different modules are adapted to special analytical requirements, e.g. load, delivery quality and earth faults. The earth fault module provides a general display of data both from AMS meters and transformer monitoring, and the module also emphasises what you do not know, so-called blind zones, and makes these clearly visible.
“Quant Insight collects all measurements that may be useful for the network. I use the map display option as my home screen. It’s easy to make reliable assessments. We now have better operational reliability and uptime. We also save on valuable engineer resources as both the number of call-outs and time-consuming searches for earth faults have been reduced significantly. This releases engineers who can be better utilised building the power network – as that’s what we need,” says Gjørven.
 An example of phase break on Meløya which was identified and located with the help of Quant Insight.
The solution means that most faults can be detected early on and preferably before customers notice. AMS alerts mean that many incidents can be solved from the office – ranging from diagnosis of contact failure in the low-voltage network to helping customers locate earth faults. During storms and bad weather, hundreds of customer calls become unnecessary as AMS data on power outages are presented on a customised outcome map, which is displayed on the power company’s website. This means that customers know that the power company knows.
“We also have far fewer duty call-outs as we see fault alerts as they develop and can act on them during the working day. If a holiday home loses power in a storm, we discover it well before Friday at 8 pm when customers arrive all ready to start their weekend.”
Quant Insight also offers practical support for engineers on maintenance work such as marking of cables in the low-voltage network. A brief shutdown allows the event map to display the meters that are experiencing power failure at the same time. This ensures that the system is marked correctly.
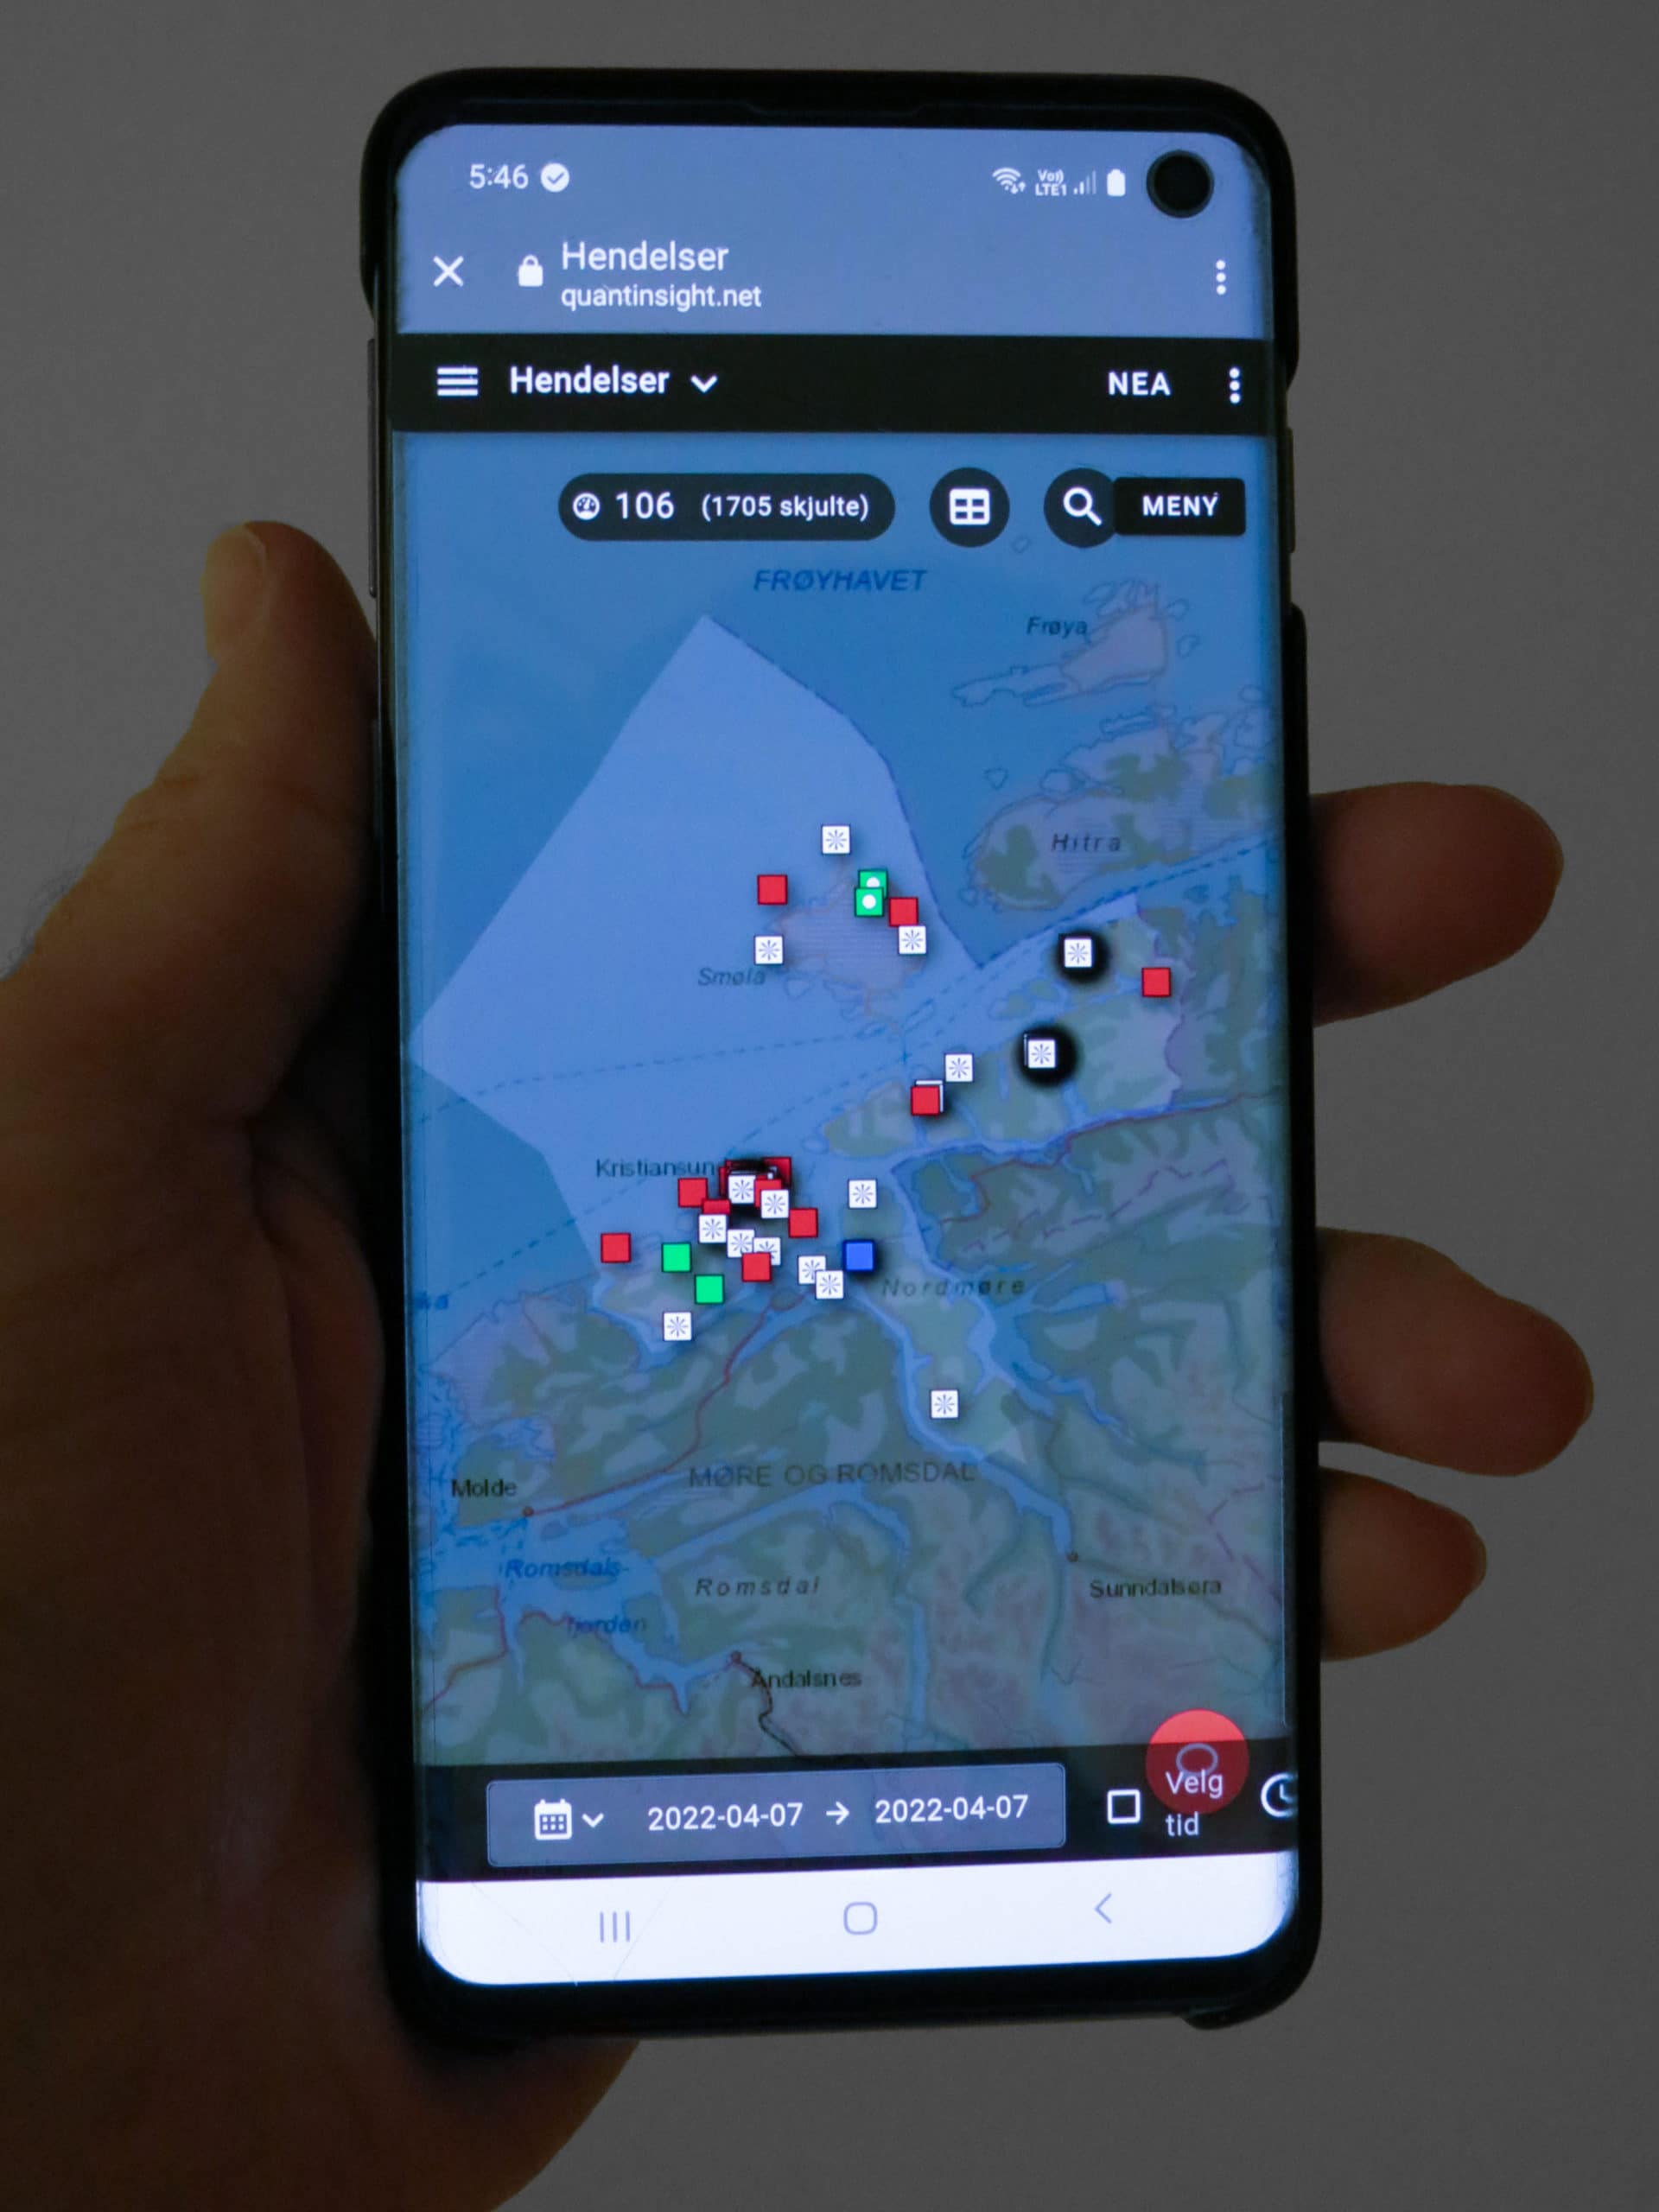 Quant Insight is also available on mobile clients and provides useful information about network events for staff working on site.
Analysis and development
The various Quant Insight modules, such as capacity, production and delivery quality, are very useful for planning the power grid for e.g. new houses and holiday homes. By being able to read real measured values from all parts of a transformer circuit, a much more precise picture of actual conditions can be obtained, and it is possible to pinpoint where problems lie. It is possible to see the load on a transformer and how much current is flowing on the lines. Different graphs show usage, recorded events, weather data and measured voltage and current with the end customer.
Embriq offers continuous follow-up and further development of the service in partnership with the customer. Mpoint, the customer service system, is used to report the need for assistance and fault correction in the daily operation of the entire infrastructure for measured values. Quant Insight also has its own idea bank where users are able to share input for system improvements. As a super user, André participates in expert groups on feature development in order to understand what the meters are saying and how to adapt the programming to what the meters are to be used for. News and updates are shared and presented in a monthly user forum where super users and system developers also participate.
Going forward
Any service and solution can always be improved, but with the continuous further development of features, it is fascinating constantly to discover new possibilities and areas of application.
“The route is short from input to programming and from roll-out to end user.”
It is also important that the power company’s basic data on facilities and grid structure are accurate and up to date, so that everything that is measured has the correct framework. The fewer old data, errors and omissions, the clearer the picture that is presented and the more precisely an error message can be addressed. Receiving a power failure alert from a meter is not much use if it has no coordinates and you do not know where it is. It can also sometimes appear to be located on the other side of the planet because the x and y coordinates have been swapped round. A separate module for data quality lists facilities where important information is missing, or the logic is not completely in place.
Why should a business choose Quant Insight?
“There is no reason not to! Everything needed to generate value for the network are met by Insight,” says a happy André Gjørven from Mellom AS.